

 All Topics









The new site launched Nov. 19.
GW’s Tracking Climate Impacts

Manuella d'Almeida
Planet Forward Reporting Intern | SUNY-Plattsburgh
November 20, 2026
GW’s Tracking Climate Impacts
Planet Forward Reporting Intern | SUNY-Plattsburgh
This year, when the new administration came in and wiped 80 webpages from the Environmental Protection Agency website about climate change, its impacts and its causes, it didn’t go unnoticed. These changes came following the Environmental Data & Governance Initiative report documenting more than 500 changes on federal websites related to climate, which initially didn’t include the EPA. These recent changes are now notably, “the most extensive removal of climate change information.” The EPA’s Climate Change Indicators website is one to name.
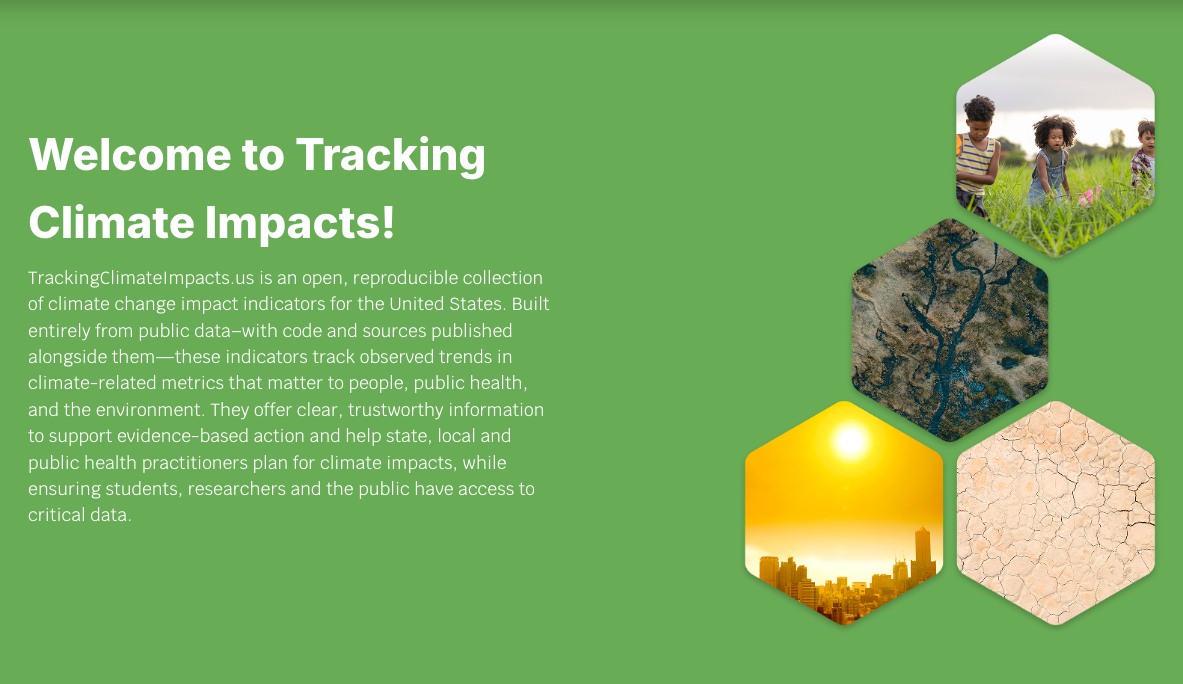
In its absence, George Washington University’s Climate and Health Institute has taken the initiative to restore the EPA’s Climate Change Indicators project. The EPA website was formerly utilized as a climate communications resource but is now only accessible as a static snapshot. GW’s Tracking Climate Impacts (TCI), which formerly launched Nov. 19, has replicated the data previously included on the website regarding the impacts of climate change in the United States.
Like its predecessor, TCI tracks observed empirical signals of climate change impacts that matter to people, public health and the environment. Some examples are: Weather and Extreme Events, Vector-Related Health and Freshwater Systems. Although some indicators are directly linked to climate change more than others, Tracking Climate Impacts documents changes relevant to climate impacts.
“As climate change accelerates, observed impacts provide one of the most powerful ways to make climate change data relevant and actionable,” said Susan Anenberg, Director of GW’s Climate and Health Institute.
This is not the first external entity to take over data collection from the EPA after the Trump administration took it over.
Climate.us, which focuses on data around climate drivers, highlighting both climate forcings, or “factors that alter Earth’s energy balance” and slow-moving climate patterns that shape multi-week to seasonal outlooks, according to the website. Climate.us launched in June by former Climate.gov project director Rebecca Lindsey, along with Mary Lindsey and Anna Eshelman, and support from more than 80 volunteer scientific reviewers.
Additionally, the University of Maryland’s Center for Global Sustainability is now producing the Greenhouse Gas Inventory and Analysis for the United States (GHGIA). This report, which covers the national-level greenhouse gas sources, sinks and gases, previously tracked in the EPA’s Inventory of U.S. Greenhouse Gas Emissions and Sinks, launched April 15, the date the EPA historically released the annual report.
Like those projects, Tracking Climate Impacts is a collaborative effort, particularly across the university. The Climate and Health Institute, or CHI, partnered with GW’s Milken Institute of Public Health’s Department of Environmental and Occupational Health for health expertise, and GW’s Engineering Management & Systems Engineering program for open data support and web development.
Led by Rona Birnbaum, director of strategic initiatives for the Climate and Health Institute and former director of the Clean Air & Power division at the EPA, the Tracking Climate Impacts team consists of several other former EPA employees who contributed to the development and launch of climate indicators while at EPA and are now staff members at the Climate and Health Institute.
“We are thrilled to restore this trusted information and build a durable foundation for future development and expanded application,” she said.
The project kicked off in summer 2026 with feasibility research, conducted by Birnbaum’s team composed of an interdisciplinary group of undergraduate, graduate, and Ph.D. students who worked to retrieve, develop, and advance the indicators.
TCI is an open-sourced project that reflects existing and emerging data, ensuring transparency and reproducibility. CHI intends to maintain and expand these climate change indicators and strengthen collaboration among users across different audiences such as local and state decision makers, community leaders, public health practitioners, students and educators, and researchers and data providers.
Thanks to the efforts of individuals who saw the value of this environmental data and the teams and universities who are supporting their work, this vital information is now insulated from political leadership changes. Now, this data will be more than just an old snapshot of historical information. It will further the work the EPA once did.

Planet Forward Correspondent | Teesside University

A project of

in collaboration with